DOM-E5057 (M01) Information Graphics; Formats and Genres
Workshop by Prof. Lily Díaz
26 – 30 Jan, 2014
- Schedule
Day 1, Monday 26.01.2015
9:00 – 9:30 Meet and greet
9:30 – 10:30
• Data values and information visualization slides from the presentation and the notes.
• Additionally here is some of the terminology we will be using when working with information visualization graphics in class.
• Data ink ratio – The concept of Data-ink ratio was invented by Edward Tufte: “Data graphics should draw the viewer’s attention to the sense and substance of the data, not to something else.”[1] Information graphics should as much as possible depict only data ink. Its counter part is Chart-junk. Check out the Infovis-wiki for more information.
• Matrix graphics – We did not get to discuss this in class. Here I refer you to Jacques Bertin’s Theory of Matrix Graphics.
• One of the most famous statistical graphics ever created is Charles Joseph Minard’s depiction of the advance and retreat of Napoleon’s army.
10:30 – 11:00 Coffee break
11:00 – 12:00 Organizing the work to be done
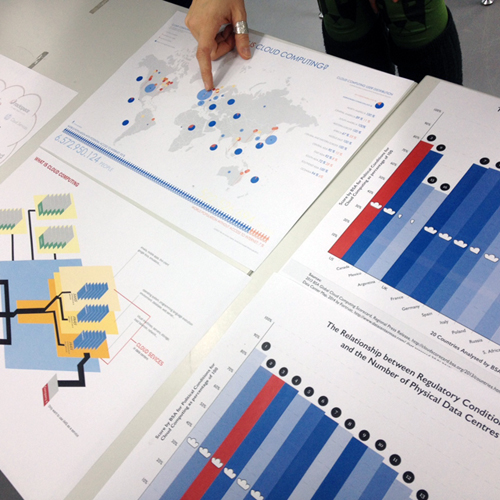
The theme that we would like to work on is: Development and political geography of cloud computing.
As your assignment last week, you were asked to read the following article in preparation for the course: Jaeger, Paul T., Jimmy Lin, Justin M. Grimes & Shannon M. Simmons, “Where is the Cloud?”, First Monday, Volume 14, Number 5 – 4 May 2009.
Today we also looked at several videos.
• Changes to computer thinking – with Stephen Fry
The video gives you a fast forward introduction to changing paradigms in information communications technologies (ICT). It introduces to you the notion of ICT as a utility that is part of our infrastructure.(Note that this is a commercially sponsored video.)
• How BIG is Google? – This video by Cold Fustion provides you with an idea regarding the scale of operations of Google, a company that is one of the drivers of Cloud Computing.
• Inside Google’s Data Center – This video by CBS provides you with a view of what it is like inside of these Data Centers.
Abowd and Mynatt noted: “There is more to context than position and identity. Context-aware systems need to be able to incorporate knowledge about time, history, other people (besides the ‘user’) as well as our environment. The 5 W’s can also be used when carrying on research. For the purposes of our research the 5 W’s include
Who – is involved in the activity?
What is the focus of the activity?
Where – is the location? Human beings describe this in different ways including physical coordinates but also in symbolic terms.
When – is it happening? For humans the experience of time is complex, involving a diversity of systems.
Why – is it happening? … The hope is that by the end of the course we will have answered this question to ourselves, at least partially.
The 5 W’s, from Abowd, D., and Mynatt E., “Charting the Past, Present, and Future Research in Ubiquitous Computing”, ACM Transactions on Human Computer Interaction, Vol. 7, No. 1, march 2000, pp. 29-58. (Accessed on 24.10. 2014)
Assignment: As your assignment for tomorrow you should complete the following exercise as we discussed in class: WHO is in evolved in cloud computing? Who are the major players?
Source(s):
[1] Tufte, Edward, The Visual Display of Quantitative Information, Cheshire, CT: Graphics Press, 1983, p. 91.
Day 2, Tuesday 27.01.2015
9:00 – 10:00 Discussion of yesterday’s assignment
9:00 – 11:00 Presentation
My Wheel of Worries by artist-designer Andrew Kuo, 2010.
“…diagrams are simply representational–things, processes, even people splayed open to view–that may or may not situate an implicit observer as spectator.” Bender, John and Michael Harriman, The Culture of Diagram, Stanford, CA: Stanford University Press, 2010. P. 14.
• Slides from the presentation are here.
Assignment: Continuing with the theme of research, today you will work on exploring and rendering the 2nd W. “WHAT is the Cloud?”,”What are its components?”, “What is a data center?”, “What are the resources?” “What are the processes?”
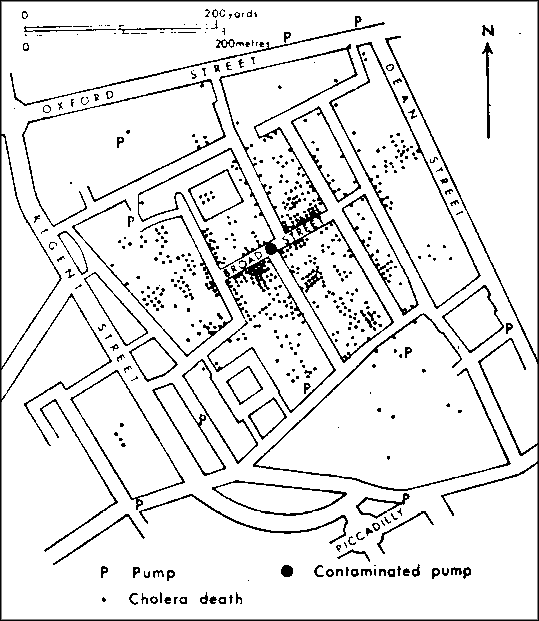
Detail from John Snow’s map describing the incidence of cholera in 1854.
Day 3, Wednesday 27.01.2015
9:00 – 10:00 Presentations of student’s works
10:00 – 10:30 Coffee break
11:00 – 12:00 Presentation – Today the presentation dealt with the genre of maps. We looked at diverse formats and studied their different characteristics and how they are used in visualization.
• Maps
• A smaller version of the slides from the presentation are here.
Assignment: “WHERE is cloud computing happening”? As part of the work done today, we research the geographical locations of companies and data centers throughout the world.
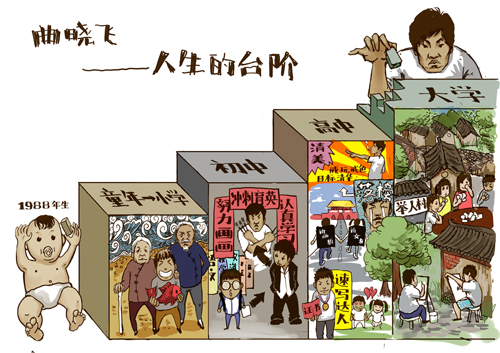
QuXiaoFei, illustration of the timeline of life.
Day 2, Thursday 28.01.2015
9:00 – 10:00 Discussion of yesterday’s assignment
9:00 – 11:00 Presentation – The morning was spent discussing timelines as a vintage genre that can be used to organize information according to time. It was an opportunity to show the wonderful work done by students during the class I gave at Tshinghua University.
Assignment: “WHEN” has it happened? Participants in the course are asked to investigate the development of Cloud Computing from the point of view of contemporary history.
FINAL PRESENTATION ON FRIDAY 30 JANUARY, 2015
at 13:00 in ROOM 414.